Key takeaways
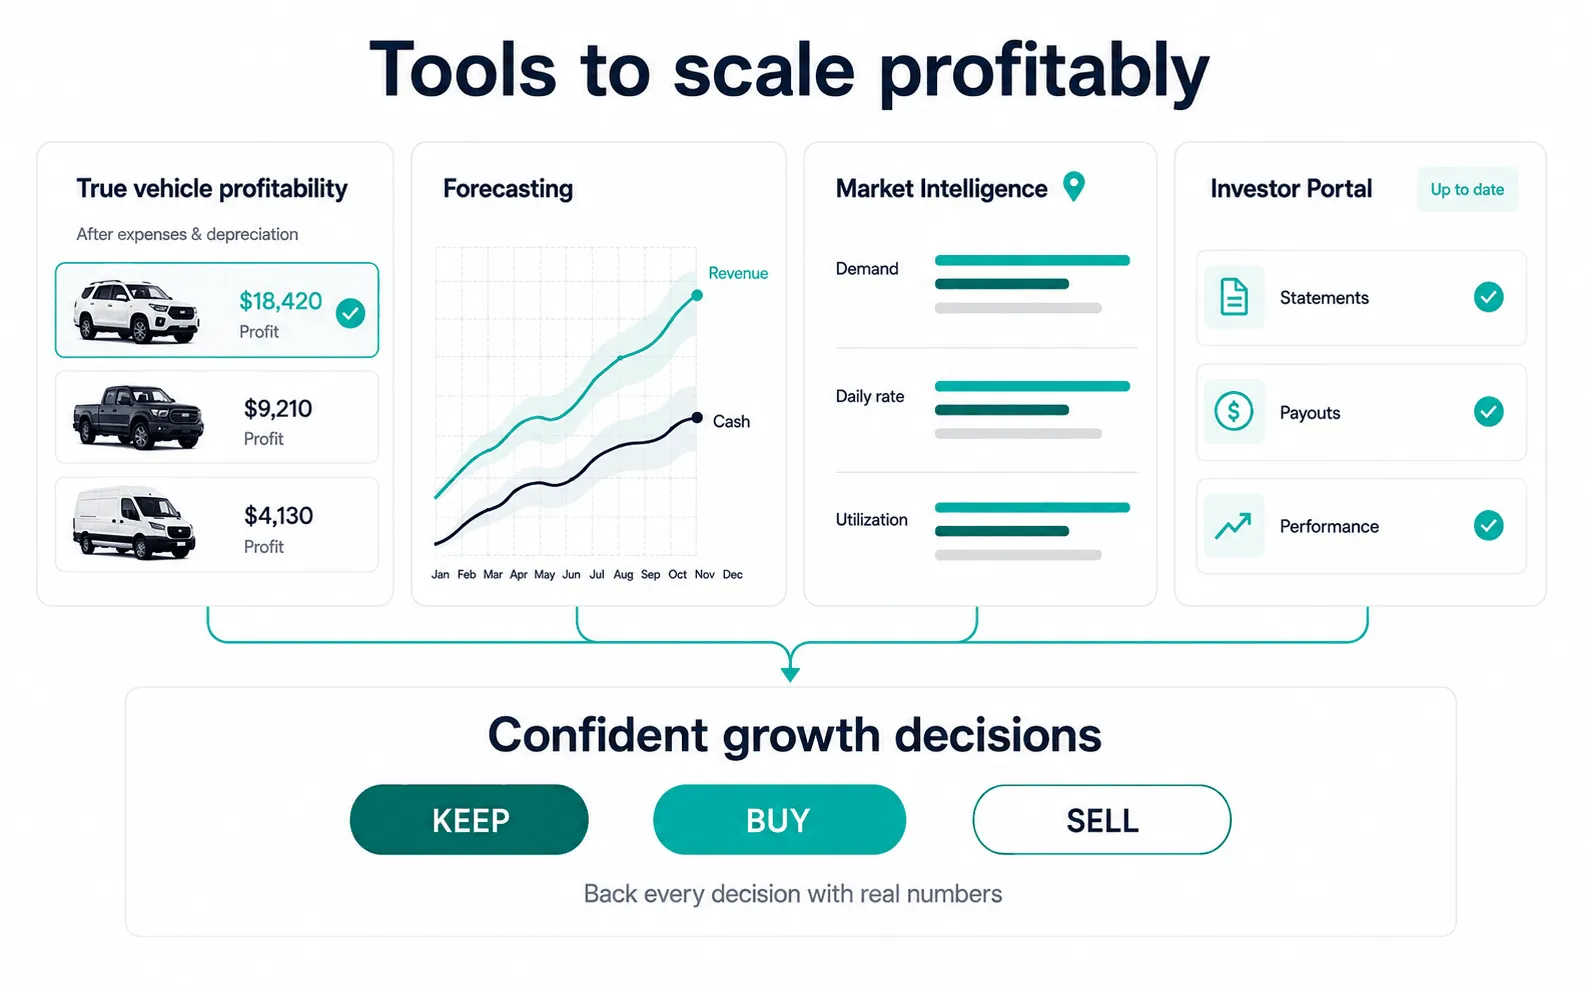
- Fleet-level revenue answers no useful question; per-vehicle profit is what decides which car to sell, replace, or buy more of.
- Attribute to a vehicle everything traceable to it — Turo’s share, cleaning, fuel, maintenance, damage responsibility, tolls, financing, insurance, registration, and depreciation — and hold true overhead at company level.
- Accrue maintenance and depreciation monthly rather than booking them in lumps, because lumpy costs make month-to-month comparison useless and comparison is the whole point.
- Earnings-plan choice is a per-vehicle risk decision: a claim-prone car may justify More peace of mind’s $250 exposure despite the lower share, a reliable one may belong on More earnings at 90% and $2,750.
- Test it this month: take your best car by revenue and subtract every cost including its note, accrued maintenance, and depreciation — if the answer surprises you, the fleet total has been hiding it.
Aggregate revenue is a comforting number that answers no useful question. In our experience most ten-car fleets with healthy totals are carrying at least one car that loses money, subsidized by the performers — and you cannot fix what the reporting hides.
Per-vehicle profit is the number that drives every real decision: which car to sell, which to replace, which segment to buy next, and which owner deal is actually worth managing.
What costs belong to a single Turo vehicle?
Revenue
- Gross trip price for trips ending in the period
- Turo’s share at the plan rate (70%, 80%, or 90%)
- Guest reimbursements collected
Direct costs
- Cleaning and turnover
- Fuel or charging not recovered
- Maintenance and repairs
- Damage responsibility on claims — $250, $1,500, or $2,750 by plan
- Tolls and citations
Carrying costs — the ones most operators omit, and the reason unprofitable cars stay invisible:
- Financing payment
- Insurance attributable to the vehicle
- Registration and any personal property tax
- Storage or parking
- Depreciation
A car with $1,282 of net payout, $350 of operating costs, and a $420 note is not making $932. It’s making $512 before depreciation — and if it’s depreciating $300 a month, it’s making $212. That’s a materially different business from the one the revenue line implies.
Accrue, don’t lurch
Maintenance arrives in lumps. A $900 brake and tire job in one month makes that month look catastrophic and the previous five look better than they were.
Accrue a monthly maintenance figure per vehicle based on its actual history, and book the real invoice against the accrual. The point isn’t accounting elegance — it’s that lumpy costs make month-to-month comparison useless, and comparison is the entire value of per-vehicle tracking.
Same logic for depreciation. A car loses value continuously and you discover it once, at sale. Booking it monthly is what makes the sale a non-event instead of a surprise.
What overhead is not
Insurance covering the whole fleet, your own time, software, an accountant — these are company costs. Spreading them across vehicles by formula produces a number that looks precise and means nothing, because the allocation basis is arbitrary and any argument about a vehicle’s performance becomes an argument about the formula.
Keep per-vehicle P&L to traceable costs, and hold overhead at company level. Two clean numbers beat one contaminated one.
This matters doubly where cars belong to owners: an allocated overhead line on an owner statement is a line you cannot defend with a source document. See Turo owner statements.
What the numbers tell you
Once per-VIN profit is visible, four decisions get easier:
Which cars to exit. A vehicle below break-even for several consecutive months, with maintenance trending up, is telling you something the revenue line never will.
Which segment to buy. Your own data beats every forum opinion about what performs. You know what your market rents and what it costs you to keep on the road.
Which earnings plan per vehicle. Plan choice is a risk decision priced monthly. A car with a claim history may justify More peace of mind’s $250 damage responsibility despite the lower 70% share; a reliable, cheap-to-repair car may be better on More earnings at 90% and $2,750. That’s only decidable with per-vehicle claim history. See Turo damage claims.
Which owner deals work. Some managed vehicles cost more to administer than they return. Per-vehicle economics is how you find out before renewal rather than after.
Doing it with FleetPilot
FleetPilot is built around exactly this: connect Turo and the bank account the fleet runs on, and trips, payouts, platform fees, repairs, tolls, and claims are matched to the right vehicle and the right owner automatically — producing a company P&L, true profit for every VIN, and owner statements from the same data, so all three agree. Start on the Free plan — no credit card required.
The prerequisite either way is a ledger where costs attach per vehicle rather than per fleet, covered in how to import your Turo earnings.
A check worth running this month
Pick your best-performing car by revenue. Subtract every cost it incurred, including its note, its share of insurance, accrued maintenance, and depreciation.
If the answer surprises you, the fleet-level number has been doing more work than it should.
Frequently asked questions
What costs should be allocated to a single Turo vehicle?
+
Anything traceable to that car: Turo's share of its trips, cleaning, fuel not recovered, maintenance and repairs, damage responsibility, tolls, storage, financing, insurance, registration, and depreciation. Costs that cannot be traced to a vehicle belong in company overhead, not spread across cars by formula.
How do you know if a Turo vehicle is actually profitable?
+
Compare net Turo payout for that vehicle against every cost it incurred in the same period, including accrued maintenance and depreciation. A car can produce revenue every month and still lose money once carrying costs and wear are counted.